Every DAC adds harmonic distortion of its own. When you measure a device under test you want the stimulus to be cleaner than the DAC can natively produce, so that what the FFT shows is the device's distortion and not the source's. Pre-distortion measures the DAC's harmonics and injects, ahead of time, an equal-and-opposite set of correction tones, so that at the ADC the converter's harmonics arrive in anti-phase with the correction and cancel. The DAC pre-distortion wizard (opened from the FFT analyser) runs this as a closed loop: measure -> invert -> apply to the running generator -> re-measure, deeper each round.
Doing it well runs into two hard measurement problems, and the wizard's whole design is the answer to them:
The correction tones the generator must produce are the DAC's harmonics, inverted. A 2nd harmonic at −110 dBc has to be measured in amplitude and phase to be cancelled, and a converter's harmonics routinely sit 100-140 dB below the fundamental. The fundamental itself, at full scale, leaks energy across the spectrum (window side-lobes, intermodulation in the ADC's own front end, clock spurs) that can swamp those faint lines.
A passive twin-T notch[1] tuned to the fundamental removes 40-80 dB of fundamental energy before the ADC, while leaving the harmonics - which fall on the notch's gentle flanks - essentially untouched. The ADC then digitises a signal dominated by its harmonics, not its fundamental, and uses far more of its range on the lines you actually want to measure. This is the suppressed-fundamental, pooled-reference regime the FFT chapter describes. The wizard's introduction makes the notch mandatory: without it the harmonics never clear the fundamental's skirt and no stable correction can form.
The network is the classic balanced twin-T: a low-pass T (R1-R2 with C3 to ground) in parallel with a high-pass T (C1-C2 with R3 to ground), sharing the ratios R3 = R/2 and C3 = 2C so the two paths cancel exactly at the null.
A twin-T notch nulls at
so its null frequency tracks the product RC. Resistors and capacitors change value with temperature, and the null is extraordinarily sensitive to that change because, right at the bottom, the notch is a true transmission zero: the magnitude plunges and the phase swings through 180° across a vanishingly small frequency span.
The plot below is an MC12 simulation zoomed hard onto the bottom of one twin-T - the whole vertical axis spans just 5 dB, drawn here on the realistic −75...−80 dBV scale a real notch actually reaches (not the −125 dB of an ideal part). A single tuning resistor is stepped in 3 ppm increments (R1 = 3120.49 -> 3120.50 Ω), a change far smaller than any temperature drift. Even that 3 ppm walks the bowl sideways enough that, at a fixed test frequency on the flank, the fundamental's level shifts by ≈ 0.9 dB.
Now add the two things a real notch cannot do. A passive twin-T is very hard to trim (a) to a very deep null and (b) onto the exact test frequency at the same time - the two adjustments fight each other. In practice the achievable depth is around −80 dB, not the −125 dB of the ideal simulation, and the tone almost never sits on the deepest point - it sits a little way up the flank. That is the worst place to be: on the flank a few-ppm component drift - a fraction of a degree of warming (the table below) - already swings the fundamental's level by ~1 dB and its phase through tens of degrees. So the suppressed fundamental's depth and phase are never something you can read reliably, which is exactly why they are taken from the generator instead.
Now read the same 3 ppm step at the 2nd harmonic. H₂ sits on the notch's gentle outer flank, not in the null, and there the identical component change is all but invisible. This plot zooms onto a few-milli-decibel window around the H₂ level: where 3 ppm threw the fundamental ≈ 0.9 dB, at H₂ it moves the level by only about a milli-decibel - some thousand times less.
Now zoom out to the whole band. The notch sits at the fundamental; the harmonics climb the gentle flank above it. The blue dots mark where the generator's fundamental F and its harmonics H₂...Hₙ land, and the two labels carry the close-ups' result onto the big picture: the same 3 ppm drift moves F by ≈ 0.9 dB deep in the null, but H₂ - and every harmonic past it - by only ≈ 1 mdB out on the gentle flank.
The asymmetry is the whole reason the wizard forces a manual fundamental taken from the generator. The fundamental's frequency is known exactly - the DDS produced it - and its launch phase is known too, so there is no need to read either off the notch output, where the drift makes them meaningless. The harmonics, measured on the flat flank, keep their amplitude and phase, and those are what the correction is built from. The wizard therefore sets fundamental-from-generator on, with the FLL locking the analysis to the generator's clock.
For a fixed tone at the nominal null, a temperature change ΔT shifts the null by the fractional change in RC:
where αR, αC are the resistor and capacitor temperature coefficients in ppm/°C. Taking the resistor as the driver (a C0G/NP0 ceramic adds only ≈ ±30 ppm/°C; a film capacitor more), for ΔT = 10 °C the null moves by the ppm in the third column, and the last three give the resulting rejection-level drift at F, H₂ and H₃ - the simulated notch's flank slope at each line times that shift:
| Resistor type | αR (ppm/°C) | Δf₀/f₀ over 10 °C | F drift † | H2 drift | H3 drift |
|---|---|---|---|---|---|
| Thin film | 5 - 25 | 50 - 250 ppm | 15 - 75 dB | 17 - 83 mdB | 13 - 64 mdB |
| Metal foil (as fitted here) | 50 - 100 | 500 - 1000 ppm | suppression lost | 0.17 - 0.33 dB | 0.13 - 0.26 dB |
| Cermet trimmer | 100 - 500+ | 1000 - 5000+ ppm | suppression lost | 0.33 - 1.7 dB | 0.26 - 1.3 dB |
† Rejection drift over 10 °C, read off the simulated notch flank. At F the tone rides the steep flank at ≈ 0.3 dB/ppm; past a few tens of ppm it has climbed off the null and the fundamental's suppression is gone - exactly why F is read from the generator, never the notch. H₂/H₃ sit on the gentle flank (≈ 0.3 mdB/ppm), a thousand-fold quieter; only a coarse cermet trimmer drifts them by as much as a decibel.
Read the other way, the 3 ppm of the close-up plot is barely 0.03-0.06 °C of warming for a metal-foil resistor - and it already cost the fundamental ≈ 0.9 dB. These look like tiny frequency moves - and on the harmonics they are: at H₂ = 2 kHz the twin-T magnitude is smooth, its slope a few dB per octave, so a 1-5 Hz shift (≤ 0.25 ‰ of 2 kHz) changes |H| by milli-decibels and the phase by a fraction of a degree. But at the null the local slope is effectively infinite. The notch's −3 dB width is f0/Q; a sub-hertz move against a null that is tens of dB deep within a fraction of a hertz throws the fundamental's measured depth and phase completely. The transmission-zero phase flip is the real damage: the loop-delay term the generator needs,
(the same relation the compensated-sine section derives) depends on the fundamental phase φ1. Read φ1 off a drifting null and the entire correction is mis-timed. Take it from the generator and the problem disappears. Conclusion: never trust a notch-suppressed fundamental's frequency or phase - define the fundamental manually.
The correction can only be as accurate as the harmonic amplitudes and phases that feed it, and after the notch those harmonics still sit far below the single-shot noise floor. Coherent averaging is what digs them out: the tone and its harmonics are phase-stable and add in step, while the noise is random and partly cancels, so the per-bin noise floor falls as the average deepens while the harmonic lines hold their level. Only once a harmonic stands well clear of the averaged floor - and has been averaged long enough to pin its value, not merely its presence - is it safe to invert it into a correction.
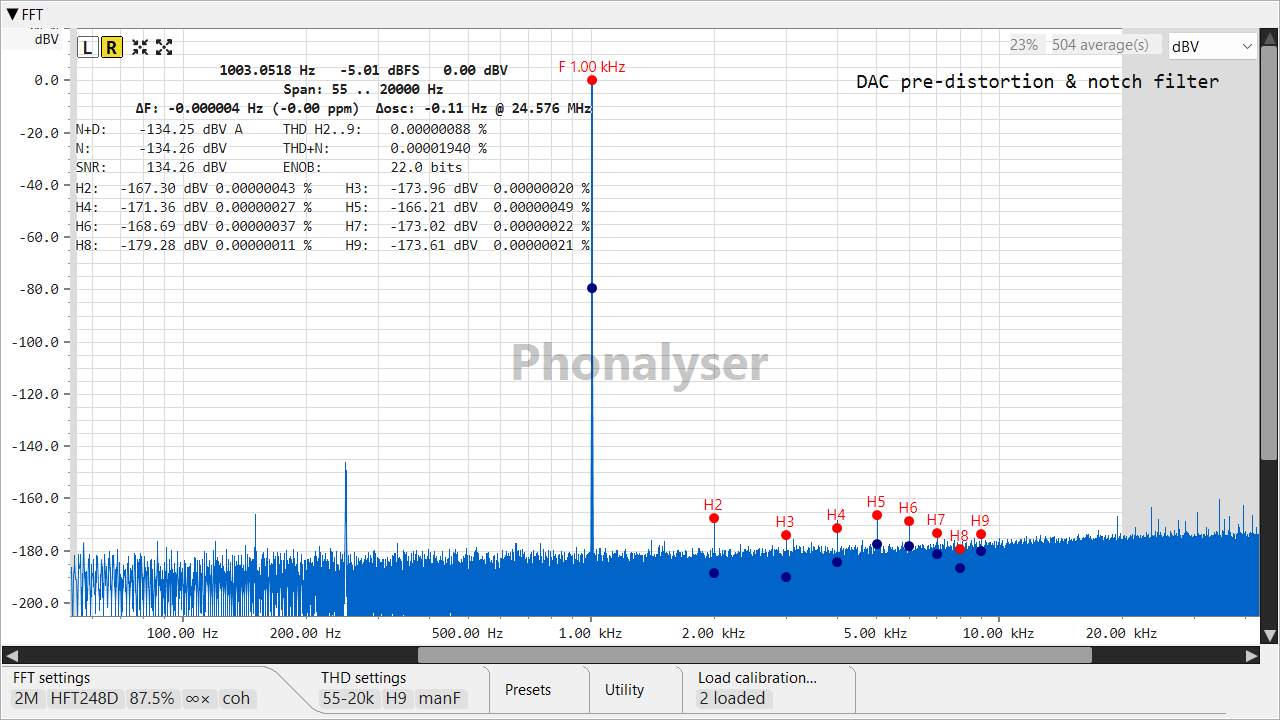
The capture below is the loop converged: a 1 kHz tone behind the notch, pre-distorted, at about 500 coherent averages. The total harmonic distortion H₂...H₉ reads 0.00000088 % - under one part in 10⁸ - with the individual harmonics down at −160 to −180 dBV, dug out of a per-shot floor more than fifty decibels above them.
Read the status strip. Bottom-left the FFT runs
HFT248D at 87.5 % overlap with ∞×
(unbounded) coherent averaging; bottom-centre manF marks the
manual fundamental. Those are exactly the settings the wizard forces - the
window and overlap for side-lobe margin at no noise
cost, the manual fundamental for the drift reason above, unbounded
coherent averaging so each round can average as deep as it needs.
A useful estimate. Coherent averaging lowers the per-bin noise floor (in power) by the effective number of independent averages neff:
with N1 ≈ −130 dB the single-shot per-bin floor. A THD of 0.00001 % is a harmonic-to-fundamental ratio of 10⁻⁷, i.e. a line at Lh = −140 dBc. To resolve it with a confidence margin M standing above the averaged floor, set N(n) ≤ Lh − M:
| margin M | neff needed | averaged floor |
|---|---|---|
| 10 dB | 100 | −150 dB |
| 20 dB | 1000 | −160 dB |
| 30 dB | 10000 | −170 dB |
So roughly 100 averages put the floor 10 dB under a −140 dBc harmonic; 1000 give 20 dB - and the ~730 of the capture above land between, which is why its harmonics resolve cleanly at −160 dBV and below. Detection is only half of it: pinning the harmonic's value (the amplitude and phase the correction inverts) follows the ordinary coherent 1/√n law on top - another reason the wizard keeps averaging deeper as the residual shrinks. Overlap enters only through neff = n/Fcorr (eq 8 there); converting neff to wall-clock at this block length is the minutes-to-hours scaling that chapter works out.
With the fundamental pinned and the harmonics averaged clean, the loop is straightforward. Each round:
The wizard's left column shows the live THD updating within a round, the averaging depth climbing, and the last round's figure; the convergence chart plots each round's residual on a log axis, spacing the markers along x in proportion to how deeply that round averaged - so a long, deep late round visibly occupies more of the trace than a quick early one.
The measurement runs the HFT248D window at 87.5 % overlap, the combination the de-rotation accuracy chapter derives from first principles. Two results from there carry straight over to pre-distortion:
The wizard's dual-tone path pre-distorts intermodulation, and that measurement meets the same wall as THD, doubled. A CCIF twin-tone test drives two strong tones - typically 19 kHz and 20 kHz at equal amplitude - and the numbers you want are the intermodulation products they create: the 1 kHz difference (20−19), the 39 kHz sum (19+20), the third-order 18 kHz and 21 kHz (2·19−20, 2·20−19), and so on - tens to over a hundred dB below the tones. Both tones must come down before the ADC, or they swallow its range and their own reconstruction artefacts bury the products.
A single twin-T centred at 19.5 kHz - midway between the tones - pulls 19 and 20 kHz down together by ~30 dB. Cascading two of them - a dual twin-T - deepens that to ~70 dB, enough headroom for the ADC to resolve the products. It must stay passive: an op-amp buffer would inject its own intermodulation exactly where you are trying to read it.
Both sections are the same 1.6 kΩ twin-T - keeping them identical gives the lowest passband insertion loss for a given tone rejection (a tapered pair loses several dB more for no extra suppression). The input impedance is ~5.5 kΩ in the product band (1 kHz) and falls toward ~1 kΩ at the tones themselves - which is exactly where the signal is being thrown away, so it does not matter. Each is a balanced twin-T (R3 = R/2, C3 = 2C) tuned to 19.5 kHz - build the ratios by paralleling identical parts and trim for depth, exactly as for the fundamental notch, and use C0G/NP0 (or film) caps so the notch itself adds no intermodulation.
| frequency | what sits there | gain | vs 1 kHz | Zin |
|---|---|---|---|---|
| 1 kHz | difference product | −21 dB | 0 (ref) | 5.5 kΩ |
| 19 kHz | lower tone | −90 dB | −69 dB | 1.1 kΩ |
| 19.5 kHz | notch centre | null | - | 1.1 kΩ |
| 20 kHz | upper tone | −90 dB | −69 dB | 1.1 kΩ |
| 39 kHz | sum product | −31 dB | −10 dB | 0.8 kΩ |
How the measurement runs, end to end:
◀ De-rotation accuracy · Theory of operation · next: Frequency response ▶